Consul, Spring Boot, Actuator, and Codahale Metrics
AKA: How to know when stuff’s fracked and how to do something about it.
In my previous post, Provisioning Consul with Puppet, I covered a first step towards ephemeral nirvana for your stack. In this post I’ll talk a little about integrating Spring Boot to further this goal.
Specifically, I’ll cover:
- Leveraging consul’s DNS server for service discovery by integrating spotify’s “dns-java” lib with Spring Boot
- Using Spring Boot’s Actuator to implement health checks and metrics reporting with our Spring Boot App.
- Incorporating Codahale Metrics with Actuator to get more control and insight into your app.
You can read my justification for writing these posts in part 1; here I’m going to jump right into the example.
Getting Started
I’m using the same Vagrant stack and demo app hosted on Github, so go get your copy now.
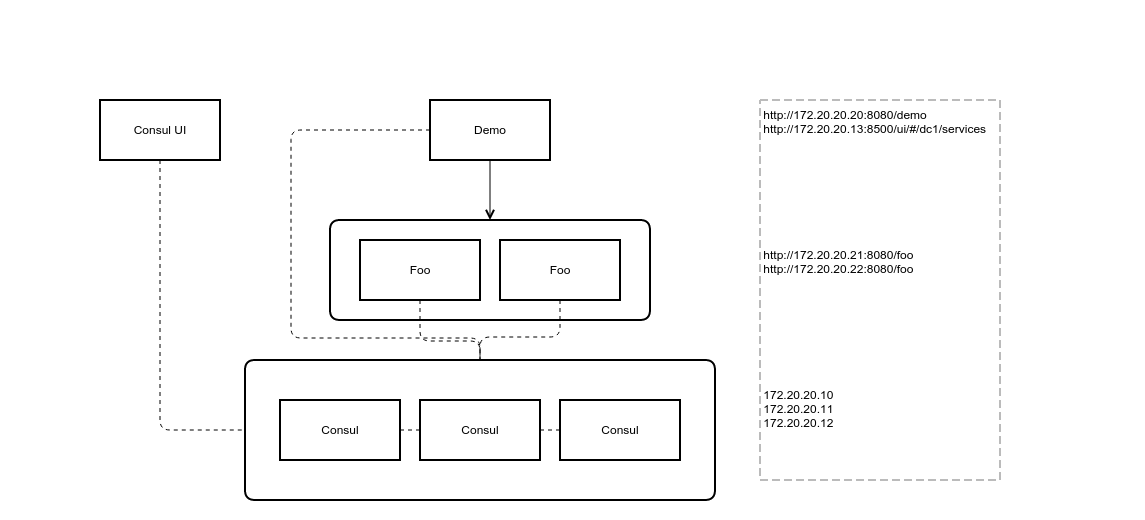
The Stack consists of:
- three Consul server nodes clustered up
- a UI to track your Consul cluster state
- a Spring Boot demo application
- a pair of Spring Boot back-end services (named “foo”) for the demo app to discover and utilize.
Running your stack:
git clone https://github.com/benschw/consul-cluster-puppet.git
cd consul-cluster-puppet
./deps.sh # clone some puppet modules we'll be using
./build.sh # build the Spring Boot demo application we'll need
vagrant up
Same steps as before (same example as before…) but I’ll point out a couple things this time.
- /demo is the java app src root
- Only one
demo.jaris used for this example, but it exposes two endpoints:/demoand/foo. (It was just easier to set things up this way, but you can pretend it is two different jars build from two source trees, each with one endpoint.) build.shjust runs “./gradlew” on this source root to build our app into a jar- I’m using spotify’s “dns-java” lib to read SRV records. At the time of writing this, functionality I needed for metrics integration only existed in master, so I’ve included a build in “/demo/spotify/.” They’re building in some additional goodness before cutting a new release.
The endpoints:
The IPs are specified in the Vagrantfile, so these links will take you to your stack
Integration
Feeling déjà vu? Good, you read the last post. But I promise that’s all over; now I’ll talk you through:
- Leveraging consul to discover services
- Producing metrics and health monitoring for your Spring Boot app
Consul Integration
I’ve included a sample “LoadBalancer” implementation in the demo to abstract out working with SRV records so that you can get the address of a service as follows:
LoadBalancingStrategy strategy = new RoundRobinLoadBalancingStrategy();

DnsSrvResolver resolver = DnsSrvResolvers.newBuilder()
		.cachingLookups(true)
		.retainingDataOnFailures(true)
		.metered(new CodahaleSpringBootReporter(metricsRegistry))
		.dnsLookupTimeoutMillis(1000)
		.build();

loadBalancer = new LoadBalancer(strategy, resolver);

HostAndPort node = loadBalancer.getAddress("foo");

// http://foo1.node.dc1.consul:8080
String address = LoadBalancer.AddressString("http", node) +  "/foo";

RestTemplate restTemplate = new RestTemplate();
Foo foo = restTemplate.getForObject(address, Foo.class);
(See the demo app using it to look up foo here)
Example Output
The output of http://172.20.20.20:8080/demo:
{
	fooResponse: {
		message: "Hello from foo1"
	},
	selectedAddress: {
		port: 8080,
		hostText: "foo1.node.dc1.consul."
	}
}
fooResponseshows the output from thefooservice, which reports back its hostnameselectedAddressshows what the consul LoadBalancer gave us back when we asked for an address indemo
Our demo app uses the LoadBalancer library to look up the SRV addresses from the Consul DNS server (supplied by the local consul agent.) It then selects one based on our strategy (round robin by default.) Finally it forms the address (A record plus port) to complete its request (this address is also resolved through the Consul DNS server.)
Health
Spring boot exposes a “Health” endpoint that allows us to query our service to see if it is running and healthy. By default this runs along side our app on the same port, but for our demo we’ve routed it to port 8081 (to keep the admin functions separate and support keeping these endpoints private in the future if we wish.)
One last piece: consul checks health by executing a script and looking at the return value, so I’ve included health.py to parse our health endpoint JSON into a return code.
Example
Typically, everything just works. So if we hit the health endpoint (http://172.20.20.20:8081/health) all we see is “UP”
{
	status: "UP"
}
If the app goes down, this page obviously won’t be here any more, but additionally we can register specific checks that can be tripped even if the app doesn’t crash (e.g. the node ran out of disk space or we can’t connect to the database.)
@Component
public class FooServiceHealthyIndicator extends AbstractHealthIndicator {

	@Autowired
	private LoadBalancer loadBalancer;

	@Override
	protected void doHealthCheck(Health.Builder builder) throws Exception {
		HostAndPort node = loadBalancer.getAddress("foo");

		if (node != null) {
			builder.up();
		} else {
			builder.down();
		}
	}
}
Sometimes we want to know about a problem but don’t necessarily want to take the application out of load balance. For example, If demo needs foo in order to function fully, but it can still run in a degraded state without it, we wouldn’t want all instances of demo to go away if Consul is reporting that no foos are available. In this case we could instead “warn” that something isn’t right, but leave the demo service available for discovery:
To modify the above class, just replace builder.down() with builder.status("WARN").
This is the way we have it implemented in the demo we’re running, so if we shut down both foo services (vagrant halt foo0 foo1) we’ll see the following from our demo health endpoint:
{
	status: "WARN"
}
Notice that our copy of demo is only in a warn state (not critical), so if something tries to resolve it through consul, it will still be available.
Metrics
Actuator comes stock with some metrics being collected, but for additional insight like timers, we need to integrate something more. Like Codahale Metrics.
Wiring Codahale metrics into Spring boot isn’t a big deal with the help of ryantenney/metrics-spring. My implementation for this example is nestled in its own package and wired up in our application config.
This allows for the use of the @timed annotation on resource methods to time all endpoints by name.
It also allows us to explicitly tap into the MetricRegistry and collect additional metrics:
lookups = metrics.timer(MetricRegistry.name(CodahaleSpringBootReporter.class, "srvlookup"));

Timer.Context context = lookups.time();
// do stuff
context.stop();
Example Output
{
	demo.meter.mean.DemoController.demo: 0.004174263352818219,
	demo.meter.one-minute.DemoController.demo: 0.029097939451186338,
	demo.meter.five-minute.DemoController.demo: 0.009890715011966878,
	demo.meter.fifteen-minute.DemoController.demo: 0.0051311229462762085,
	demo.timer.min.DemoController.demo: 2930355,
	demo.timer.max.DemoController.demo: 214477268,
	demo.timer.median.DemoController.demo: 9271362,
	demo.timer.mean.DemoController.demo: 39808608.875,
	demo.timer.standard-deviation.DemoController.demo: 72246286.59474245,
	demo.meter.mean.CodahaleSpringBootReporter.srvlookup: 0.2003580661363458,
	demo.meter.one-minute.CodahaleSpringBootReporter.srvlookup: 0.23859104066267098,
	demo.meter.five-minute.CodahaleSpringBootReporter.srvlookup: 0.2090802942145022,
	demo.meter.fifteen-minute.CodahaleSpringBootReporter.srvlookup: 0.17895849086506815,
	demo.timer.min.CodahaleSpringBootReporter.srvlookup: 1604057,
	demo.timer.max.CodahaleSpringBootReporter.srvlookup: 125254192,
	demo.timer.median.CodahaleSpringBootReporter.srvlookup: 2939579,
	demo.timer.mean.CodahaleSpringBootReporter.srvlookup: 3894239.9505208335,
	demo.timer.standard-deviation.CodahaleSpringBootReporter.srvlookup: 6640297.013684536,
	demo.gauge.gauge.response.**.favicon.ico: 9,
	demo.gauge.gauge.response.demo: 33,
	demo.counter.CodahaleSpringBootReporter.srvlookupempty: 320,
	demo.counter.CodahaleSpringBootReporter.srvlookupfailures: 2,
	demo.counter.counter.status.200.**.favicon.ico: 1,
	demo.counter.counter.status.200.demo: 8,
	demo.counter.counter.status.304.**.favicon.ico: 2
}
Oh Yeah! I forgot to mention that we are timing our SRV address lookups. There are also counters for lookup failures and occurrences of empty result sets (successful query, but no available services to connect to.)
This stuff is crazy useful and gives you data you can aggregate without babysitting your nodes.
Next steps
So you’ve got Consul running and now you can make use of it (also see Service Discovery for Golang with DNS for my writeup on using Consul in Go).
A glaring omission of this post is how to actually do anything with your health and metrics data. Consul will operate on your health checks, but how can you incorporate this feedback with other things (like low memory and disk space, nodes reaching cpu capacity, or whatever else has traditionally been a pain in your ass?) Additionally, we haven’t really talked about how to capture or aggregate all those metrics we’re providing now.
we’ve run out of time… but here are some ideas…
- Sensu
- has a slew of community plugins for tracking the health of common components
- uses Nagios style checks just like Consul, so you can monitor your health endpoint with this too
- can serve as a metrics collector, passing on the data to something else (like graphite)
- Statsd collect your metrics with this, optionally with codahale integration; also has Graphite integration
- Graphite graph and expose your metrics once you have them
- Graphene integrate with graphite and protect your eyes from unnecessary bleeding.
Pull my leg and I might show you how to build that out too.
comments powered by Disqus